Connect Superset to ClickHouse
Apache Superset is an open-source data exploration and visualization platform written in Python. Superset connects to ClickHouse using a Python driver provided by ClickHouse. Let's see how it works...
Goal
In this guide you will build a dashboard in Superset with data from a ClickHouse database. The dashboard will look like this:
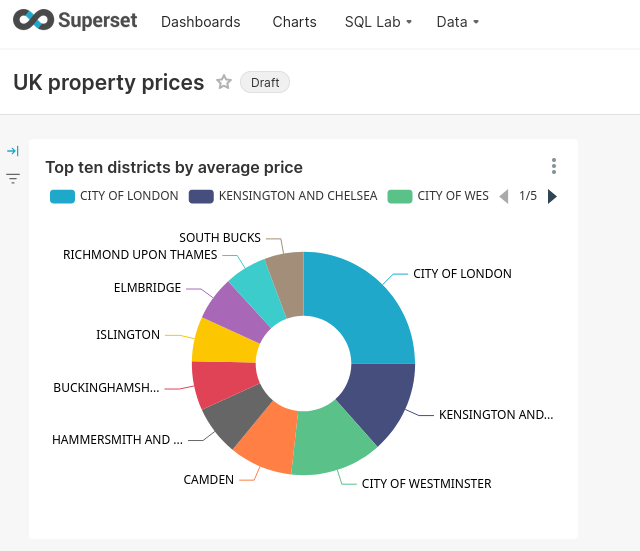
If you do not have a dataset to work with you can add one of the examples. This guide uses the UK Price Paid dataset, so you might choose that one. There are several others to look at in the same documentation category.
1. Gather your connection details
To connect to ClickHouse with HTTP(S) you need this information:
| Parameter(s) | Description |
|---|---|
HOST and PORT | Typically, the port is 8443 when using TLS or 8123 when not using TLS. |
DATABASE NAME | Out of the box, there is a database named default, use the name of the database that you want to connect to. |
USERNAME and PASSWORD | Out of the box, the username is default. Use the username appropriate for your use case. |
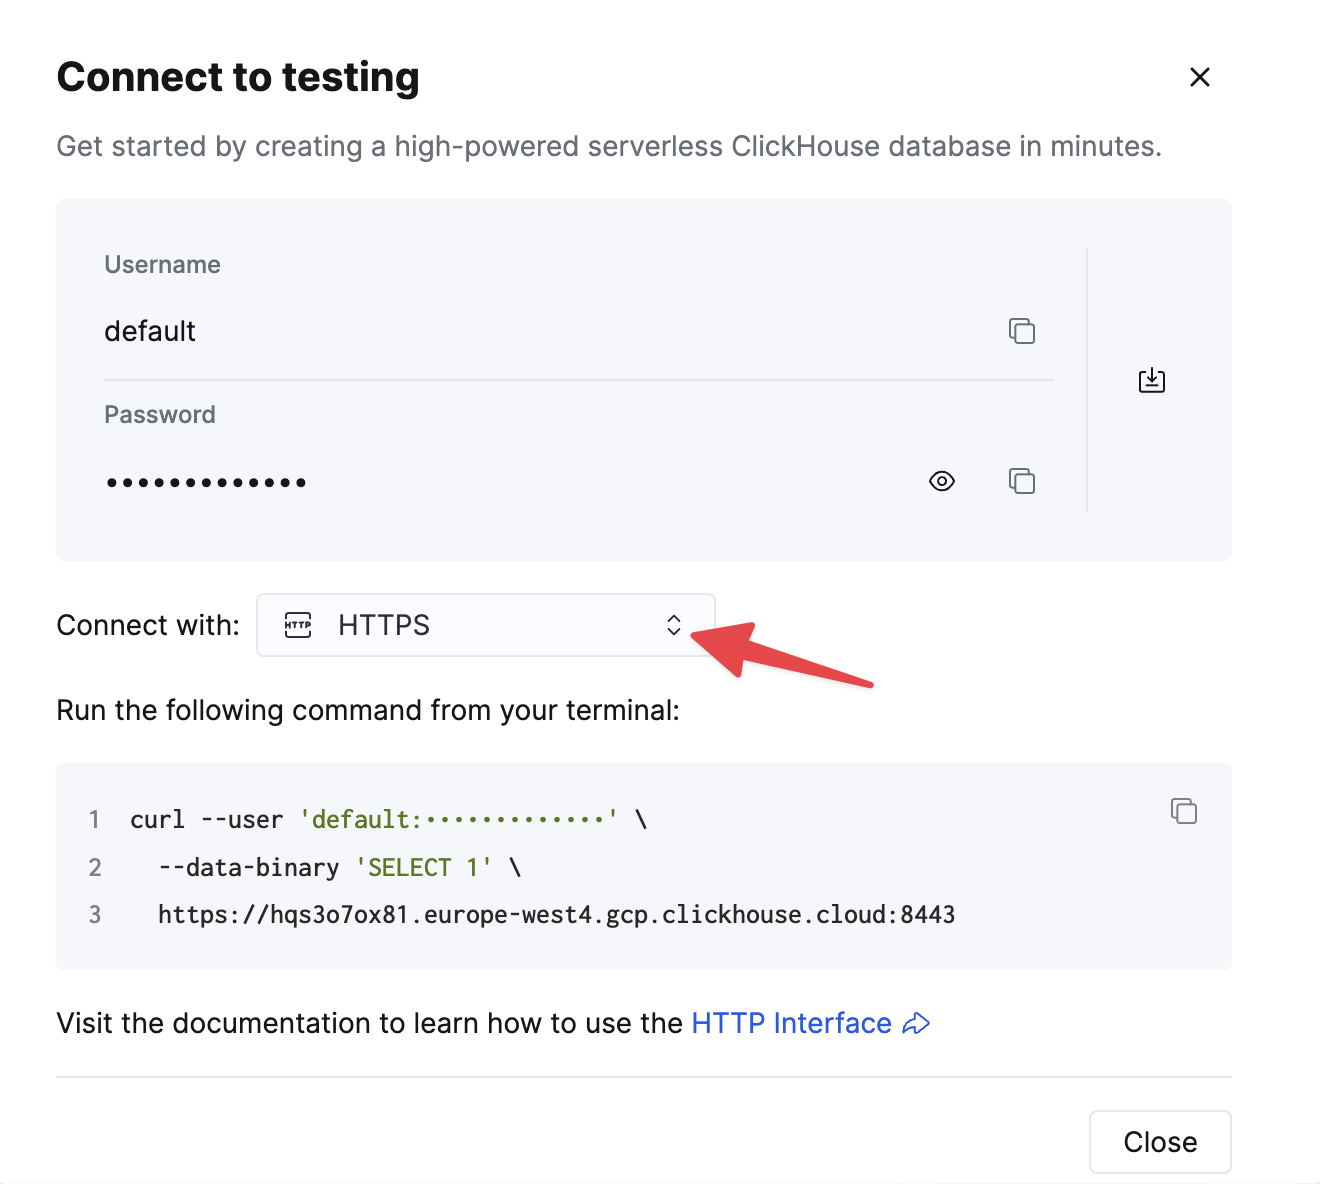
The details for your ClickHouse Cloud service are available in the ClickHouse Cloud console. Select a service and click Connect:
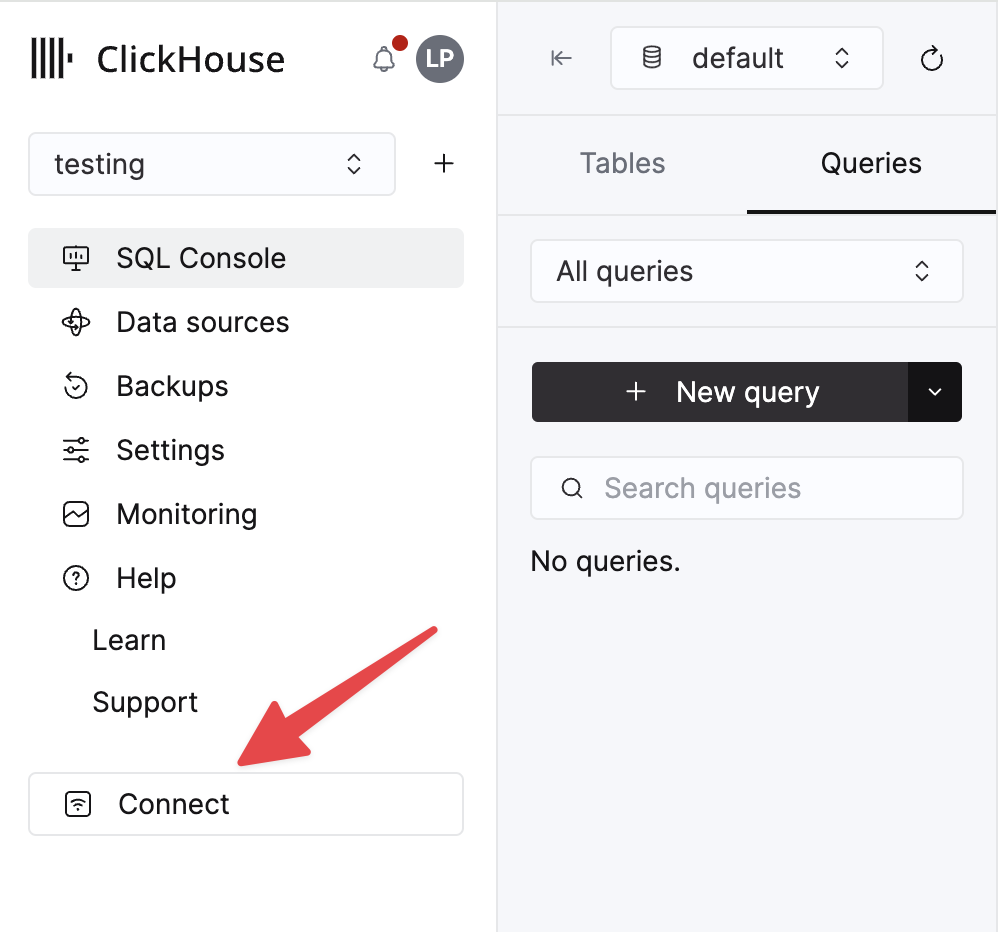
Choose HTTPS. Connection details are displayed in an example curl command.
If you are using self-managed ClickHouse, the connection details are set by your ClickHouse administrator.
2. Install the Driver
-
Superset uses the
clickhouse-connectdriver to connect to ClickHouse. The details ofclickhouse-connectare at https://pypi.org/project/clickhouse-connect/ and it can be installed with the following command: -
Start (or restart) Superset.
3. Connect Superset to ClickHouse
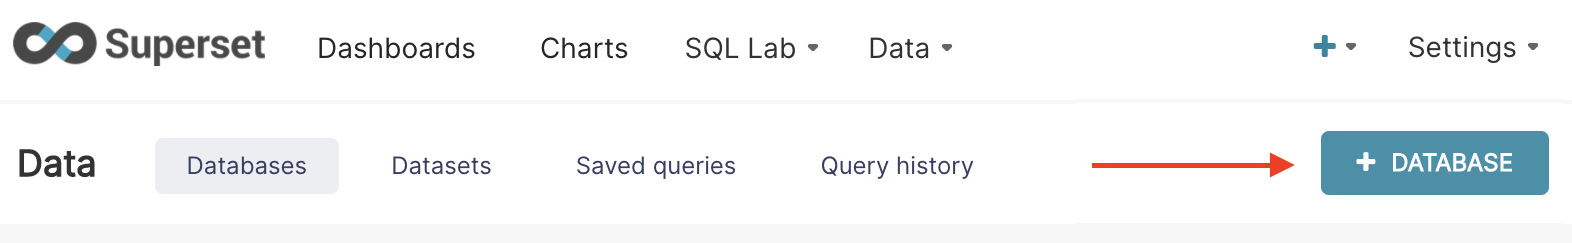
- Within Superset, select Data from the top menu and then Databases from the drop-down menu. Add a new database by clicking the + Database button:
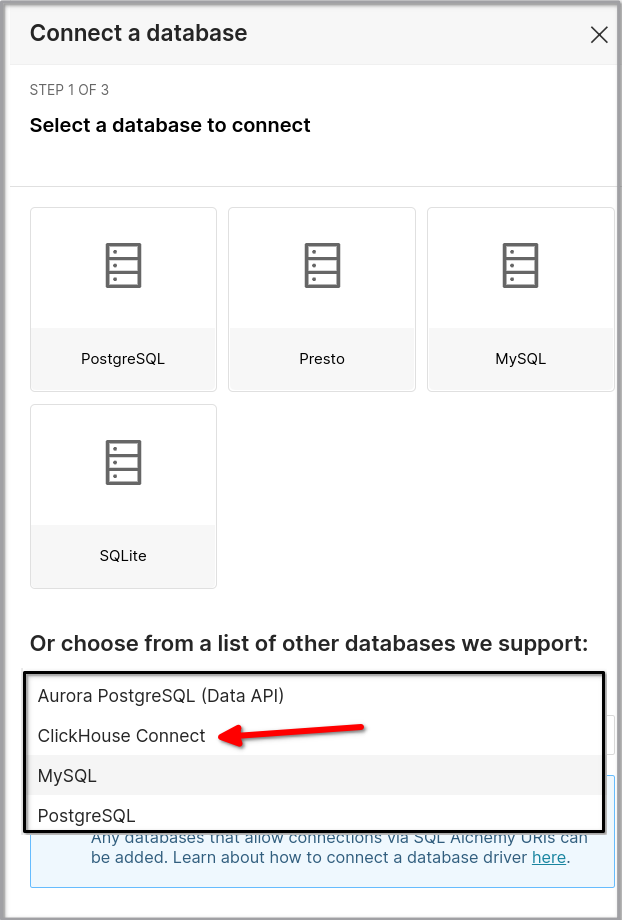
- In the first step, select ClickHouse Connect as the type of database:
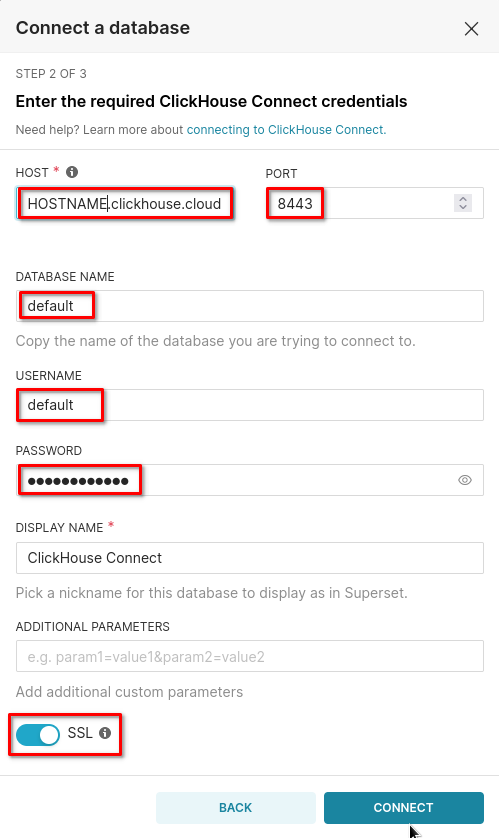
- In the second step:
- Set SSL on or off.
- Enter the connection information that you collected earlier
- Specify the DISPLAY NAME: this can be any name you prefer. If you will be connecting to multiple ClickHouse databases then make the name more descriptive.
- Click the CONNECT and then FINISH buttons to complete the setup wizard, and you should see your database in the list of databases.
4. Add a Dataset
-
To interact with your ClickHouse data with Superset, you need to define a dataset. From the top menu in Superset, select Data, then Datasets from the drop-down menu.
-
Click the button for adding a dataset. Select your new database as the datasource and you should see the tables defined in your database:

- Click the ADD button at the bottom of the dialog window and your table appears in the list of datasets. You are ready to build a dashboard and analyze your ClickHouse data!
5. Creating charts and a dashboard in Superset
If you are familiar with Superset, then you will feel right at home with this next section. If you are new to Superset, well...it's like a lot of the other cool visualization tools out there in the world - it doesn't take long to get started, but the details and nuances get learned over time as you use the tool.
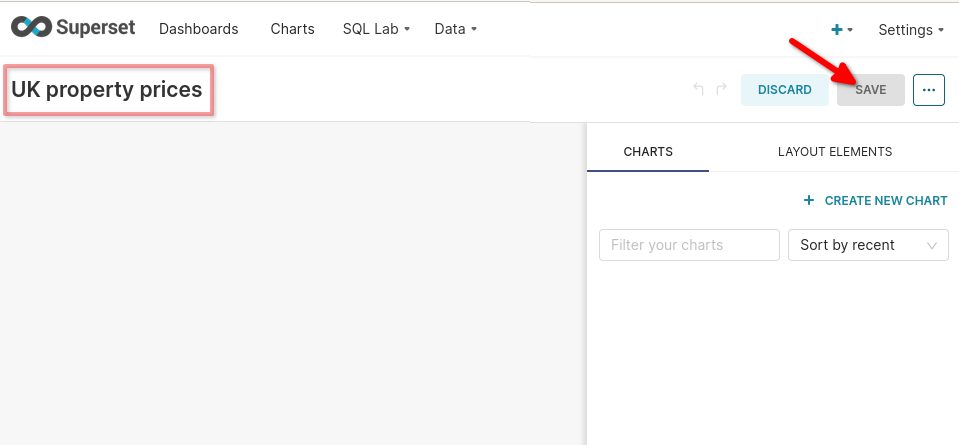
- You start with a dashboard. From the top menu in Superset, select Dashboards. Click the button in the upper-right to add a new dashboard. The following dashboard is named UK property prices:
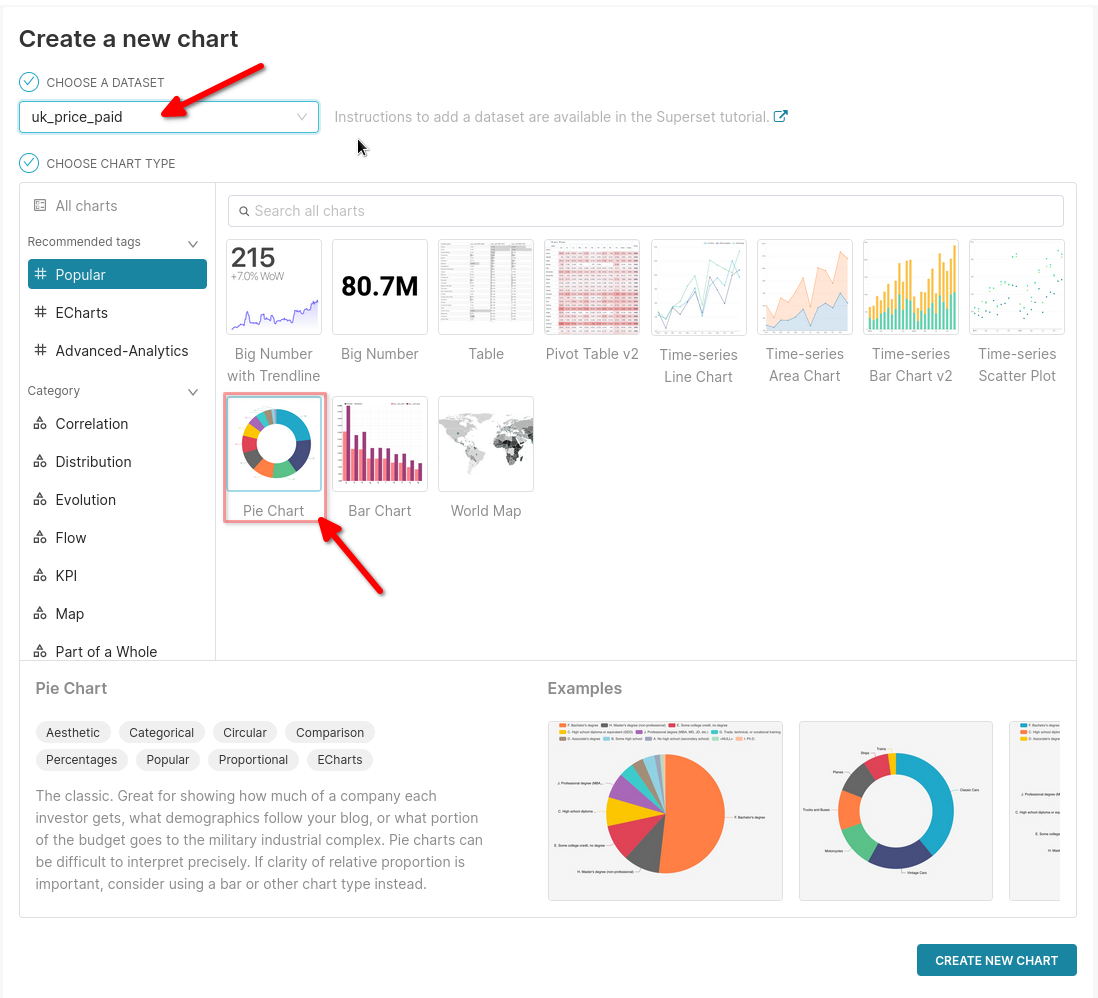
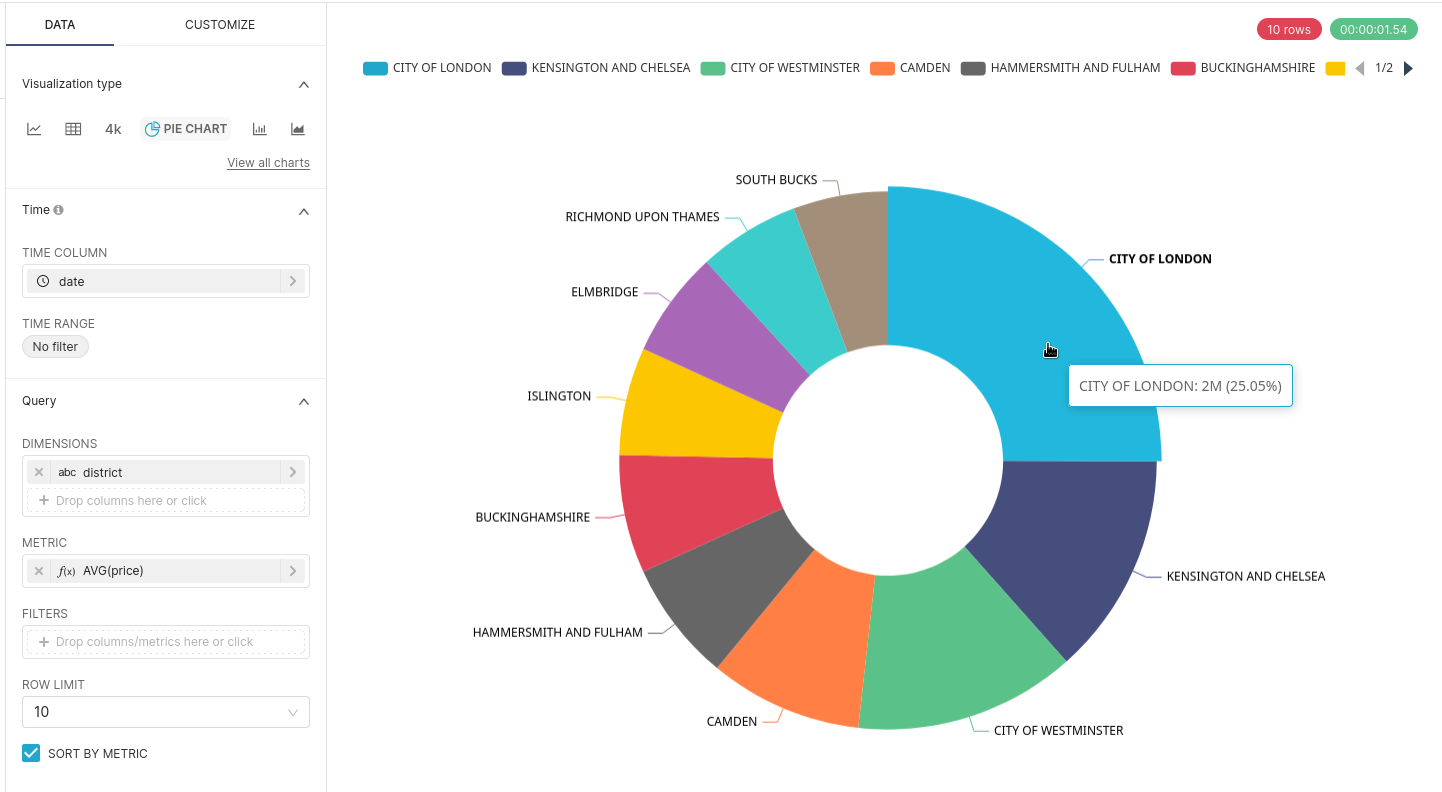
- To create a new chart, select Charts from the top menu and click the button to add a new chart. You will be shown a lot of options. The following example shows a Pie Chart chart using the uk_price_paid dataset from the CHOOSE A DATASET drop-down:
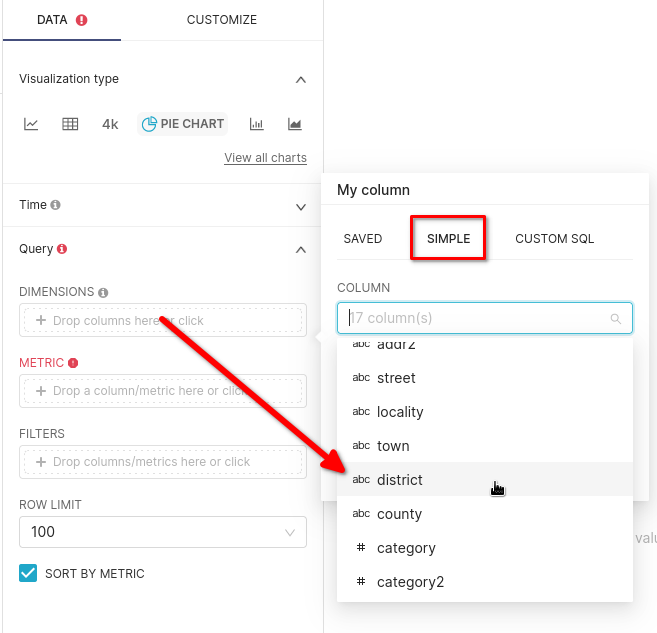
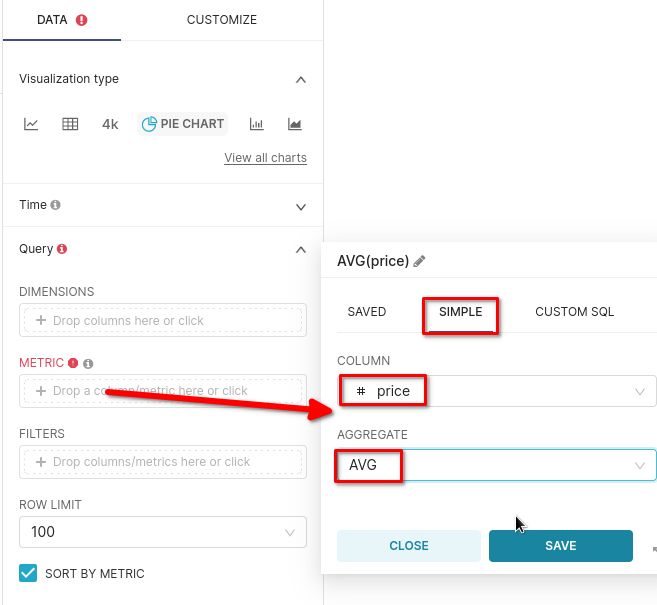
- Superset pie charts need a Dimension and a Metric, the rest of the settings are optional. You can pick your own fields for the dimension and metric, this example uses the ClickHouse field
districtas the dimension andAVG(price)as the metric.
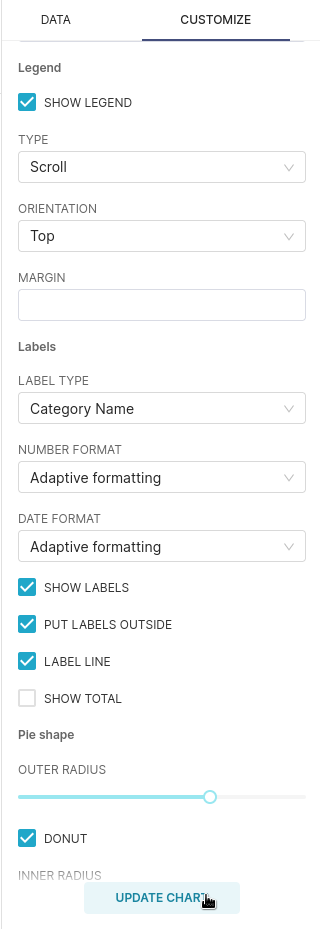
- If you prefer doughnut charts over pie, then you can set that and other options under CUSTOMIZE:
- Click the SAVE button to save the chart, then select UK property prices under the ADD TO DASHBOARD drop-down, then SAVE & GO TO DASHBOARD saves the chart and adds it to the dashboard:
- That's it. Building dashboards in Superset based on data in ClickHouse opens up a whole world of blazing fast data analytics!
